
- Mobile devices account for at-least half of all E-Commerce traffic in 2023.
- Having a fast Mobile store is crucial not only for SEO, but for CRO too! Learn the logic behind Mobile optimization, and begin building for performance in this guide.
- Written for both Store owners and experts alike – feel free to contact us with any questions you have!
Use the Proper Tools to Begin Real-time Evaluation
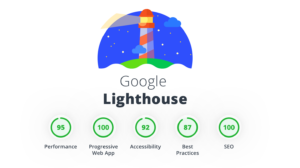
In order to benchmark to view your store’s real-time performance, you’ll need some tools to do so. These tools are 100% free (and mostly are provided by Google themself)By using the proper tools, it will make all the difference, because there are so many tools available out there, the crucial thing to check for is that the technology under-the-hood has to be running on Google’s Lighthouse, this is vital in order to actually get a real benchmark that will be used in your SERP (Search Engine Results Page).
Other tools may give you a useful output, although the catch is, if it’s not using Lighthouse then you may not be optimizing what Google are looking for.
Simply being fast all-round helps, but Google is looking for a specific criteria which they continually improve and revisit, this criteria is called ‘Web Core Vitals’ and has recently had a new pending addition, the INP – Interaction to Next Paint.
Paint is a specific terminology used in these metrics, it refers to the time it takes to display an image on the users device screen (to actually light up the pixels – e.g painting them on the display)
💡 Google’s actual ranking algorithm is still very much a black box, that’s intentionally unknown, and a closely guarded secret, in order to avoid manipulation.
This is why we are always encouraged to use their official tools; so we can reduce the likelihood that the advice is incorrect, a misinterpretation, or a black hat technique which results in penalization rather than optimization.
Black hat techniques must be avoided at all costs because they will end up doing more harm then good.
Even if black hat gains work today, tomorrow is never guaranteed.
✅ We Recommend Using the Following for Benchmarking:
- Pagespeed Insights – https://pagespeed.web.dev
- Chrome DevTools – https://developer.chrome.com/docs/devtools/
- Web Page Test (Also uses Lighthouse for Google Core Web Vitals) – webpagetest.org
- Shopify Theme inspector for Chrome – https://chrome.google.com/webstore/detail/shopify-theme-inspector-f/fndnankcflemoafdeboboehphmiijkgp
- Shopify App Detector by Fera.ai – https://chrome.google.com/webstore/detail/shopify-app-detector-by-f/lhfdhjladfcmghahdbcmlceajdlbkale
Core Web Vitals: Pass grades aren’t impossible, more a balancing act!
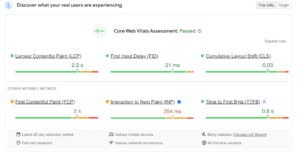
👉 Run your website’s domain through pagespeed.web.dev – most of the data you’ll want is displayed right at the top of the Pagespeed insights result
- The standard traffic lights system is used of Green, Amber and Red (Pass, Moderate / Warning, Fail)
- Under the six metrics, pay close attention to the small text at the bottom, as it helps explain the data more.
👍 Even though two are amber; we still get a pass grade here!
FCP (First Contentful Paint, the first image to be displayed) and INP (Interaction to Next Paint, in short, the combined time for interaction throughout the pageload)
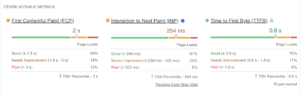
Click expand, and you’ll see some core web vitals are not actually officially being used in SERP ranking by Google yet.
As clear as mud? It can get really confusing, so don’t blame yourself – this field is constantly evolving and permanently under development, therefore to further confuse things, these metrics above are subject to change (and some are experimental or pending)
👉 Best practice: Always try to score as high as you can, whilst balancing your requirements for as optimal a Conversion rate as possible.
This will keep you future-proof as you are using the most recent available info from Google.
But Why Isn’t the Shopify ‘Speed Score’ Updating? 🫤

This is how a 95+ store displays in Shopify. Even with super high scores, a perfect hundred in Shopify is extremely rare.
The ‘speed score’ displayed in your Online Store > Themes section is a fairly new addition that Shopify have added since Google’s huge algorithm update of 2021, which finally publicly confirmed that Core Web Vitals are used in determining your ranking.
The problem is it’s a little unclear what this score is, and how it’s determined at first glance.
💡 Speed score = **A trailing average of your Home, Collection and Product pages scores. The speed score is** a combined average that Shopify made-up to try and make it all simpler.
Although the end result is that it confuses many people because the scores simply wont align with a Google Pagespeed insight score, because they are combined trailing averages. This is why it says 7 days on the left. It’s the average for the past 7 days.
Why Does the Score Keep Changing From Day to Day, Test to Test?
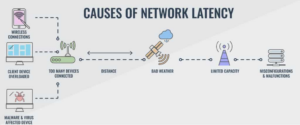
In a nutshell – Variable latency.Variable latency means a connection that may take 100ms to complete sometimes, while other times seemingly at random takes way longer, even going over a second (1000ms+)
The kicker here is, variable latency is completely outside of your control, it also cannot truly be optimized, other then by not using whatever is causing it. Which may not of been the optimization you had in mind!
💡 Hardly any third-party apps will publicly market the fact that they are a performance hog and slow the store down, as it’s simply bad for business and a direct conflict of interest.
In a perfect world – they would make their service fast, but it’s not always possible and if your data is their business, there’s a reason it’s free and you have to agree to an EULA. Remember that with some apps, even from big corporates, you are the product.
You can always contact customer support and ask if they can make it faster and increase resources etc, but in general you’ll find a dead end of pleasantries, scape goating and buck passing.
The simple truth is they cannot make it faster without development and upgrades and that means costs. Technology and business has constraints and we cannot just request the impossible and hope it happens one day. We need a fast store today.
Even with fiber and 5G, once you’ve got past your own router and out onto the open net, this is where the real problems begin. All technologies involved have physical limitations. Being conservative and expecting problems is the mindset to engage.
Workable Improvements Rather Then Playing the Blame Game
The connection made between your device and Shopify in order to load the Store, is affected by the external internet network performance.There’s so many possible points of failure, having as streamlined and lightweight a configuration as possible is the sure way to win this war.
💡 Just because an app or service is slow in the current configuration, doesn’t mean anyone besides ourselves is to blame.
It’s your configuration after all, and no one forced you to make these choices. It’s just that customers / Google that expect a fast and beautiful store, that we find ourselves in this predicament.
It could be Shopify that’s experiencing network congestion, or your ISP, or any of the hops between on the route from your end to Shopify… and back. It’s not productive to point fingers as it’s the overall performance that must be judged, as the whole configuration working together as one.
The only person who has full unwaived executive control of that, is the Store owner. So the finger pointing must start at oneself to be productive here.
Generally speaking, when using Shopify directly – there’s never much of an issue, besides on peak times when it’s BFCM (Black Friday / Cyber Monday) or Christmas and the New year sales. It’s third-parties and overuse of the back-end that cause the issues.
👉 Latency during peak congestion can be avoided by using professional grade DNS, because you will be paying access to business-class reserved routes that are for serious e-commerce and companies only and no longer by in the public / free lane.
- Shopify have gone to great extents over the years to ensure their service is super fast, and recently completely overhauled the Online store into OS 2.0 in order to keep the service speedy and using cutting edge techniques.
- Although what they cannot optimize or improve on is when you include third-parties into the mix!
When considering all of the improve, Less is more. Minimalism is core to having consistent scores, as each third-party extra that’s added, increases the chance for variable latency.
How To Benchmark Your Store and Perform Fine Tuning Adjustments Yourself
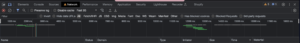
First of all load your webpage in your desktop browser, right click and open the inspect element developer tools panel. It will appear at the bottom of your browser window.
- Here you will notice there are several tabs at the top. You want to look first at the Network tab.
- Click the network tab and refresh your page (cmd+R) you’ll see the request list fill and the timeline at the top will have green and grey rectangles appear from left to right.
To view just third-parties:
Find the toggle in the top right labelled 3rd-party requests and turn it on, in order to view requests that come from outside of Shopify.
👉 Because Shopify is a SaaS (Software-as-a-Service) there’s very little that can be done to optimize it directly and it’s all down to the third-party apps we add and our own configuration choices.
Reading the Requests List – Reducing Backend Usage
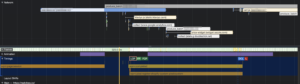
Once the requests have populated from refreshing the tool you will see many entries like the one below. The first column on the left is the name of what is being requested. The domain is where it comes from.In the example below – if you see requests to your own domain (here I’ve pixelated my clients address) that are taking over 1 second it’s due to over use of the Shopify backend.
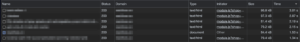
👉 As you can see here from the
Size column – these requests are tiny, all at under 100kB, as small as a product thumbnail but they take an eternity to load.
The combined load time is going over 10 seconds.
- These slow requests are all from sections in the the theme.
- The theme is official and installed from the Theme store, it’s on OS2.0 and running the latest version, and still we have this trouble.
- The only way to optimize this is to open the theme customizer and remove the sections and then save and refresh the page.
❌ The problem is the page cannot finish loading until the data from those requests has been returned to the client side in order to display those theme sections.
✅ Reduce the sections on the page, hit save and refresh a couple times to see how the requests are shaping up now to optimize this yourself.
Reading the Performance Metrics
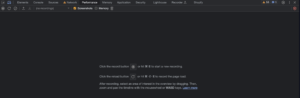
With the requests handled, lets dive deeper and take a look at those Core Web Vitals.
Click on the Performance Tab at the top, by default to the right of the network tab and then hit the record button and reload the page in order to generate your performance output.
👉 It’s a little bit un-user friendly here, you need to hit record, then reload the page yourself and then wait until it’s fully loaded and press the stop button.
The performance diagnostics window will populate now with many rectangles that again go from left to right in order to illustrate the loading timeline of your store.
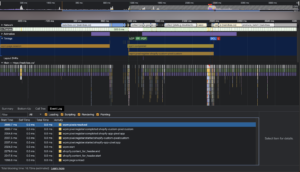
Look closely at the timings section – here you will see something familiar.
- LCP (Largest Contentful Paint)
- FP and FCP (simply FCP in lighthouse, FP = first paint)
- DCL (DomContentLoaded – the event that is fired at the end of the load, the last stage before finish)
Here you can see what’s happening at the network level, prior to the largest contentful paint timing.
Klaviyo, the shopify backend (product_batch) and just connecting to the domain (blue rectangle above) is all holding up getting any images to show.
Scroll your mouse wheel up, or push up on your touch pad to zoom in further.
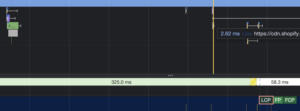
Hover your mouse over each of these rectangles to see what is going on. In this case they are all third-party apps or from the Shopify backend.
So how do we use this to optimize the LCP and FCP? We remove anything we can that’s occurring in this list prior to those timings.
This can be done in two ways:
- Uninstalling / reducing usage on the applicable items – such as number of theme sections.
- Adding resource hints for pre-loading, although this must be done correctly or it can further delay loading as resource hints will fine tune what happens prior. We want to ensure anything that isn’t deferrable can be preloaded using resource hints.
Need help adding resource hints and tuning your store? Give us a call and consider it done!
What About Tricking the Benchmark by Adding a Delay?
Thinking like this was fairly common place years ago, most probably due to natural human behavior – we have a tendency to look for simple answers and shortcuts.Unfortunately, it doesn’t work with Google.
Google’s tooling was advanced enough 5 years ago to do basic things like scrolling a page in order to ensure it emulates human behavior.
In the modern era, it also goes much further then that and performs many more tests, in both desktop and mobile environments.
After all, this is a super important tool; the linchpin in the whole search engine marketplace really, Google have spent multiple decades developing their algorithm, so their not going to let a simple hack of delaying the load actually work and undermine all of the development they have done in attempting to organically rank websites.
In fact they really did build their system to look for things like this by design, and downgrade ranking when detected in a purely natural and non-biased way. It’s just looking for the real deal is all and cannot be easily spoofed or fooled.
👉 Anyone who is trying to get a high score by using the optimize apps in the App store that delay loading, buying a service from a freelancer that delays loading, or using a script someone provided to delay loading are purely delaying high scores from becoming a reality.
Don’t do it. Just delete a few sections and only show your best products with a view more link. It’s really all there is too it!
How to Move Forward from Here?
Clearly, we now know that PageSpeed optimization is a crucial field of knowledge that requires using the correct tooling to get the job done well. It’s also a game of checking and changing.
- You need to first run analysis, interpret the results, perform a change based on that and test again.
- It’s a long iterative cycle that, if you enjoy computers as a hobby you can definitely get good at and perfect your store.
I hope you learned somethings to help speed up your store, thanks for reading – if you have any questions feel free to reach out to us and discuss it further 👍
Leave A Comment